
Most New Jersey Students Are Not Proficient in Math
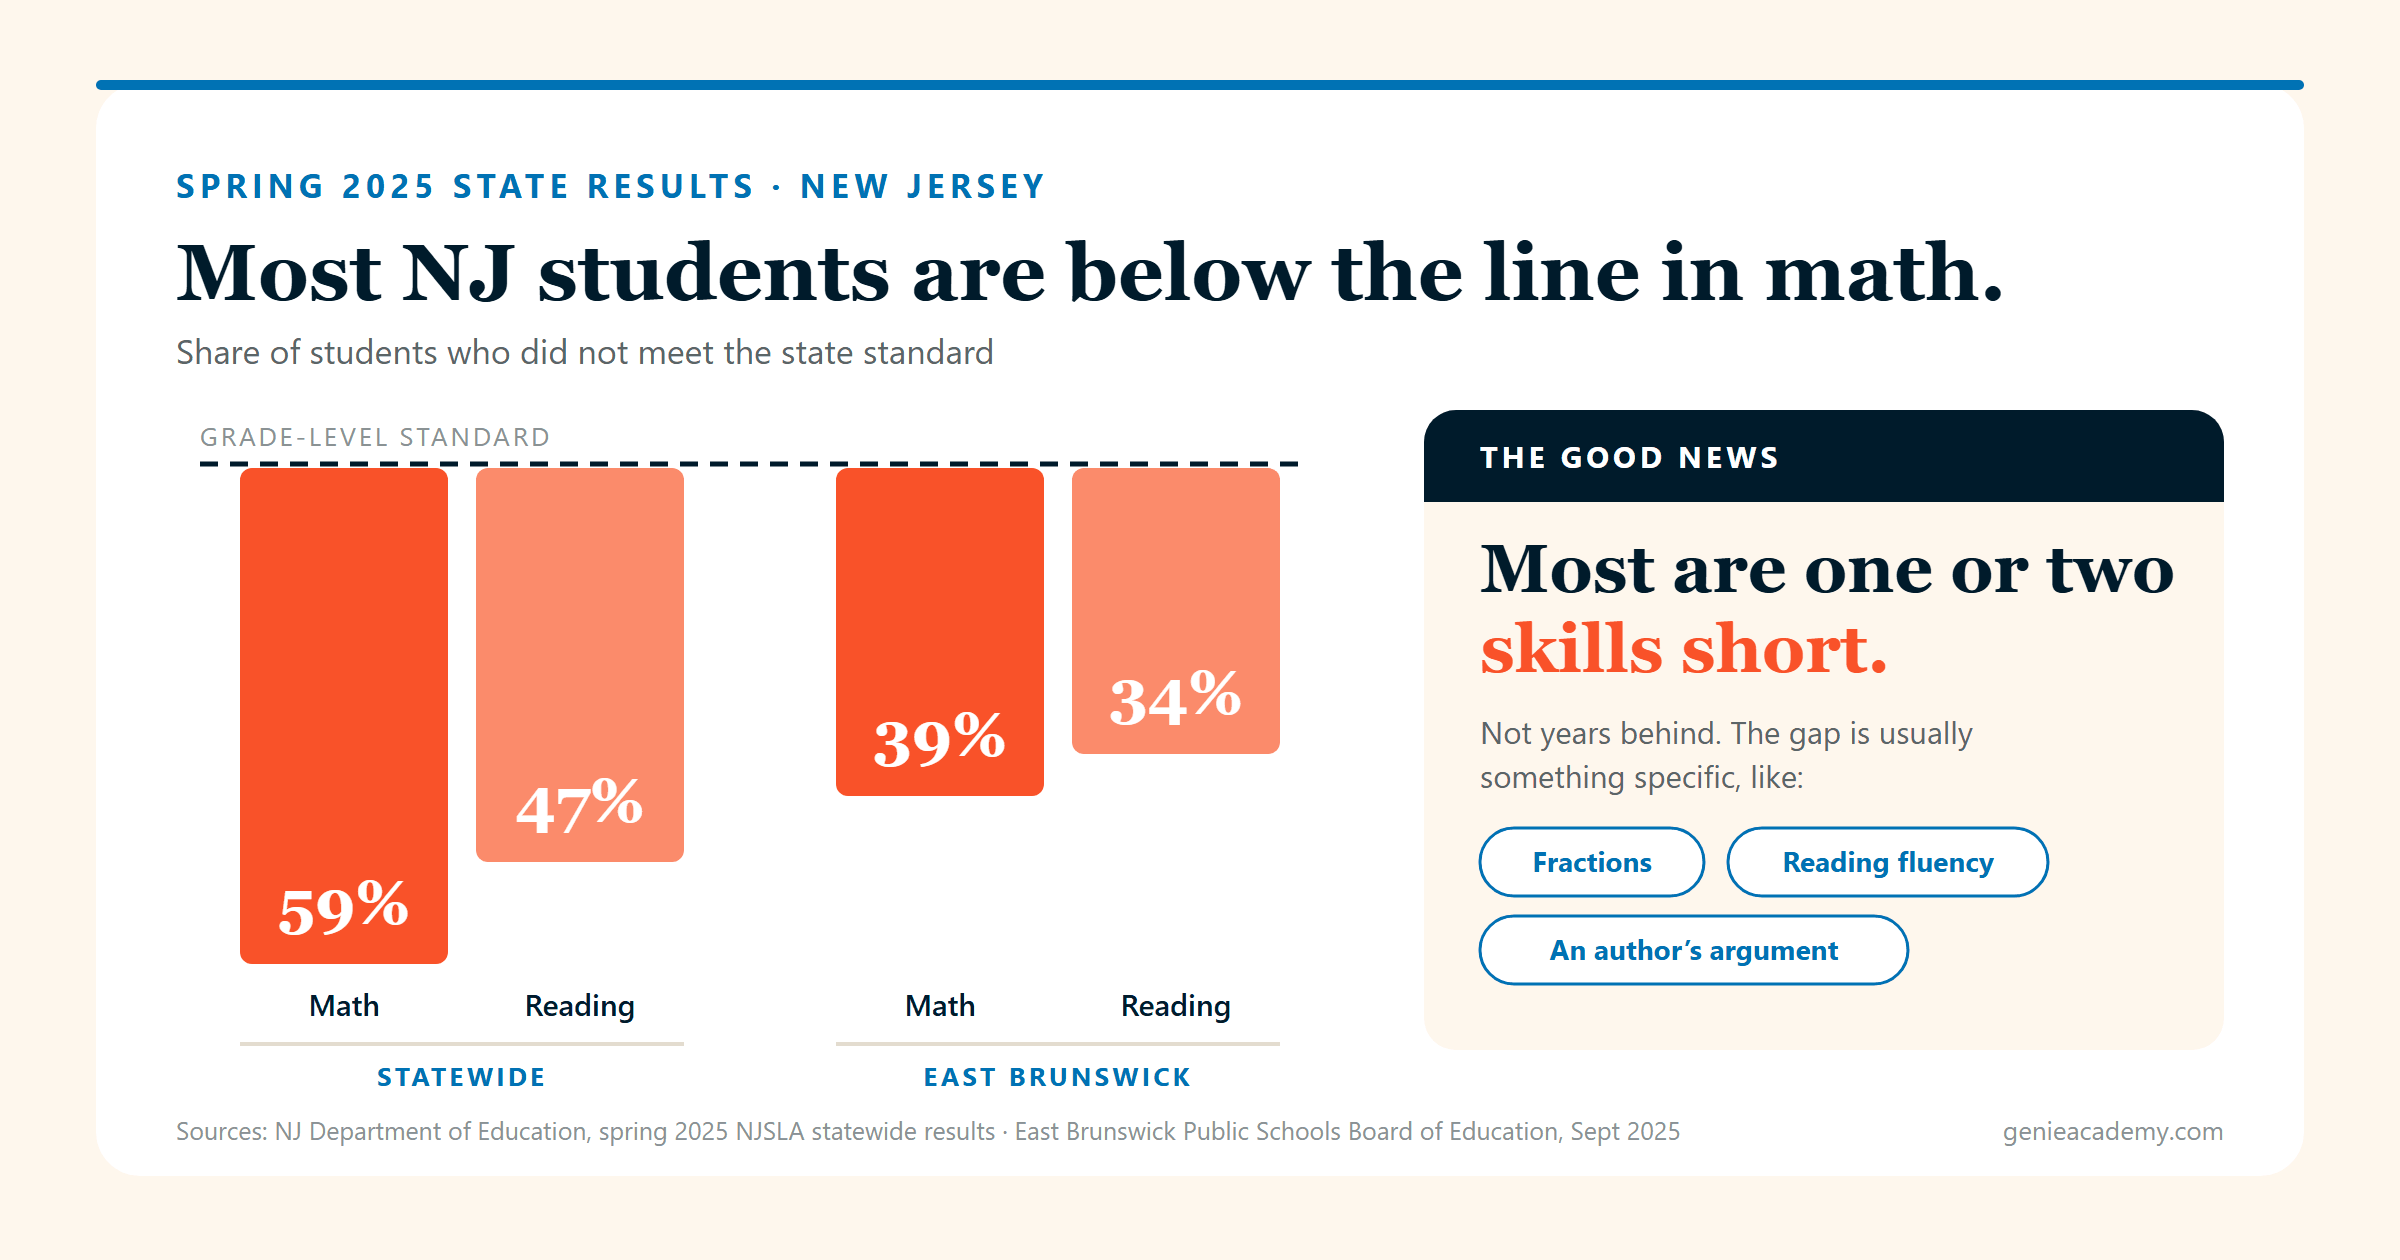
Fifty-nine percent of New Jersey students are not proficient in math.
Forty-seven percent are not proficient in reading.
Those are not the numbers for struggling schools. They are not the numbers for one troubled district. They are the statewide averages from New Jersey’s most recent complete state test results.
This is our warning sign. Most children in this state are below grade level in math. Most parents have never been told.
| New Jersey, spring 2025 | Met the standard | Did not meet the standard |
|---|---|---|
| Mathematics | 41% | 59% |
| English language arts | 53% | 47% |
It gets worse the older they get
The state has released early results from the spring 2026 test. Reading first.
47.2% of third graders met the reading standard. 45.6% of fourth graders did. In both grades, more than half of New Jersey children did not reach grade level in reading. (We broke down what the third and fourth grade reading results mean in a separate post.)
Then math in eighth grade. 22.5% met the standard. Fewer than one in four New Jersey eighth graders met the math standard.
One important caveat on that figure, because it matters and most coverage skips it. That eighth grade number covers the standalone grade 8 math test. Students taking Algebra I or Geometry sit a different exam and are counted separately, and those tend to be the stronger math students. So the real picture for all eighth graders is better than 22.5%.
It is not good. But it is better than that number alone suggests, and you deserve the honest version. (More on that in our look at the eighth grade math results.)
This is also true in the good districts
The usual reaction to statewide numbers is that they describe somewhere else. Cities, underfunded schools, other people’s children.
East Brunswick is one of the stronger districts in New Jersey. On its own Board of Education’s reporting of spring 2025 results, 66% of students were proficient in English language arts and 61% in math. Which means:
- 34% were not proficient in reading.
- 39% were not proficient in math.
Roughly one in three children in one of the state’s stronger districts is below the line.
A district average describes a district. It does not describe your child. An excellent school can be excellent and your child can still be on the other side of that line, and the school average will never tell you which.
Why you have never seen these numbers
If this is the first time you are reading them, that is not your fault. Three things keep them out of view.
Reporting prints the good half. Every news story says 41% of students were proficient in math. Almost none says 59% were not. Same fact, opposite feeling, and the subtraction is left to you.
The results arrive late. Children sat the 2026 test in spring. Score reports reached districts in September. By the time a parent sees the number, the school year it describes is over and a new one has started.
Averages hide individuals. A strong district average is reassuring and genuinely earned. It also says nothing about any particular child inside it.
The part that should worry you most
Scores falling is the headline. It is not the real finding.
The decline is not spread evenly. It is almost entirely at the bottom.
On the international math assessment, between 2019 and 2023, the lowest-performing American fourth graders lost 37 points. The highest-performing fourth graders did not measurably change at all.
The same split shows up in reading. The distance between the strongest and weakest American readers is now the widest of any country measured, first out of 89 systems, and that spread has grown by 50 points since 2015.
Children who were doing well are still doing well. Children who were behind are falling further behind. The average is dropping because the bottom is dropping.
Two ordinary forces do this. Skills compound, so a child who reads well reads more and gets further ahead while a child who reads haltingly avoids reading. And gaps do not pause, so a child who is behind in June is rarely closer in September on their own.
New Jersey is a top state. That is the point.
Everything above is true of a state that performs near the top of the country.
On the national assessment, New Jersey ranks third in the nation in fourth grade reading and second in eighth grade reading. Genuinely excellent.
Math is a different story. New Jersey’s fourth grade math score is not statistically different from the national average.
And the national average sits in an uncomfortable place globally. On the 2025 international assessment of 15-year-olds, the United States scored 463 in math. The average across OECD countries is 463. Exactly average, 27th of 91 education systems. American reading and science both land well above average. Math does not.
So the ladder runs like this. New Jersey is near the top of the United States in reading, average within it in math, and the United States is middling globally in math. Being above the New Jersey average in math is roughly being average in the developed world.
None of this means the schools are failing. New Jersey schools are, by national measures, among the best in the country. It means the ceiling most families are measuring against is lower than they think.
What this means for your child
Statistics are only useful if they change a decision. Here is the practical translation.
Being in a good district is not evidence. It raises the odds. It does not answer the question. One in three children in a strong district is below grade level in math.
Good grades are not evidence either. A report card folds in homework, effort, participation and work done with help available. The state test is one sitting, alone, against a fixed bar. A hardworking child in a supportive classroom can look strong all year and still miss specific grade-level skills.
Two moments carry more weight than the rest. Reading in grades 3 and 4, because after that every subject starts assuming the skill is in place. And math in grades 6 to 8, because that is when course placement gets decided, and middle school placement shapes what is available in high school.
How to find out where your child actually is
- Read past the headline on the score report. The subscores break performance into areas like reading literary text, reading informational text, and writing. A child can be solid in one and weak in another, and the overall level hides it.
- Ask for the K-3 literacy screening results. Under a 2024 state law, New Jersey schools screen every child from kindergarten through third grade for reading twice a year and must notify parents within 30 days. If you have not seen them, ask.
- Ask the teacher a specific question. Not “how is my child doing,” which gets you a kind answer. Ask “which specific skills should we work on between now and spring?”
- Get an independent assessment. Something scored against grade-level standards that names the missing skills rather than handing you a level.
The good news, and it is real
Here is what the numbers above do not tell you.
Most children on the wrong side of the proficiency line are not years behind. They are one or two specific skills short. Reading fluency rather than decoding. Fractions rather than all of math. Working out what an author is arguing rather than reading in general.
A child sitting just below the line is usually close to it. That is a much smaller problem than the label implies, and it is the single most useful thing to understand about this whole subject.
What moves a child across is unglamorous. Specific work on the exact missing skill rather than more hours of general help. Short, consistent practice rather than occasional long sessions. And often, changing a child’s belief that they are bad at a subject, because a child who has decided that will work around the subject rather than at it.
Timelines are measured in months, not weeks. Anyone promising faster is selling something.
Where we fit
Genie Academy runs a free assessment that answers the question a score report leaves open: which specific skills are solid and which are not. It takes about an hour, and we walk you through the results skill by skill instead of handing you a level.
Our coaches teach in classrooms of six students maximum. The curriculum is built by the same coaches who teach it, aligned to New Jersey standards. Our pricing is published on our site so you can see it before you speak to anyone.
If the numbers at the top of this page were new to you, the useful next step is not to worry. It is finding out which side of the line your own child is on, and which skills would move them.
Get a free assessment for your child today to see where they actually stand.
For the full grade-by-grade picture of the 2025 results, see the number every New Jersey parent needs to see.
Sources: NJDOE spring 2025 NJSLA statewide results, December 2025. NJDOE preliminary spring 2026 NJSLA-A results, September 2026. NCES, NAEP 2024 reading and mathematics, January 2025. OECD, PISA 2025 Results Volume I, September 8, 2026. IEA and NCES, TIMSS 2023 US Highlights, December 2024. East Brunswick Public Schools Board of Education assessment presentation, September 18, 2025. P.L. 2024, c.52. NAEP and NJSLA set proficiency at different bars and are reported separately throughout.
Frequently asked questions
What percentage of New Jersey students are not proficient in math?
On New Jersey's spring 2025 state tests, 59% of students did not meet the math standard and 47% did not meet the English language arts standard. These are statewide averages, not the figures for one struggling district.
Are students in good New Jersey school districts proficient?
Not all of them. East Brunswick, one of the stronger districts in the state, reported that 61% of its students were proficient in math and 66% in English language arts in spring 2025. That still means 39% were not proficient in math and 34% were not proficient in reading.
My child gets good grades. Can they still be below grade level?
Yes. A report card folds in homework, effort, participation and work done with help available. The state test is one sitting, alone, against a fixed bar. A hardworking child in a supportive classroom can look strong all year and still miss specific grade-level skills.
How far behind is a child who is not proficient?
Usually not very far. Most children on the wrong side of the proficiency line are not years behind. They are one or two specific skills short, such as reading fluency rather than decoding, or fractions rather than all of math.
How can I find out where my child actually is?
Read past the headline on the score report to the subscores, ask your school for the K-3 literacy screening results, ask the teacher which specific skills to work on before spring, and get an independent assessment that names the missing skills rather than handing you a level.
Want to make learning this fun every day?
Book a free 60-minute assessment and we'll build a plan for your child.
Get Your Child's Free Assessment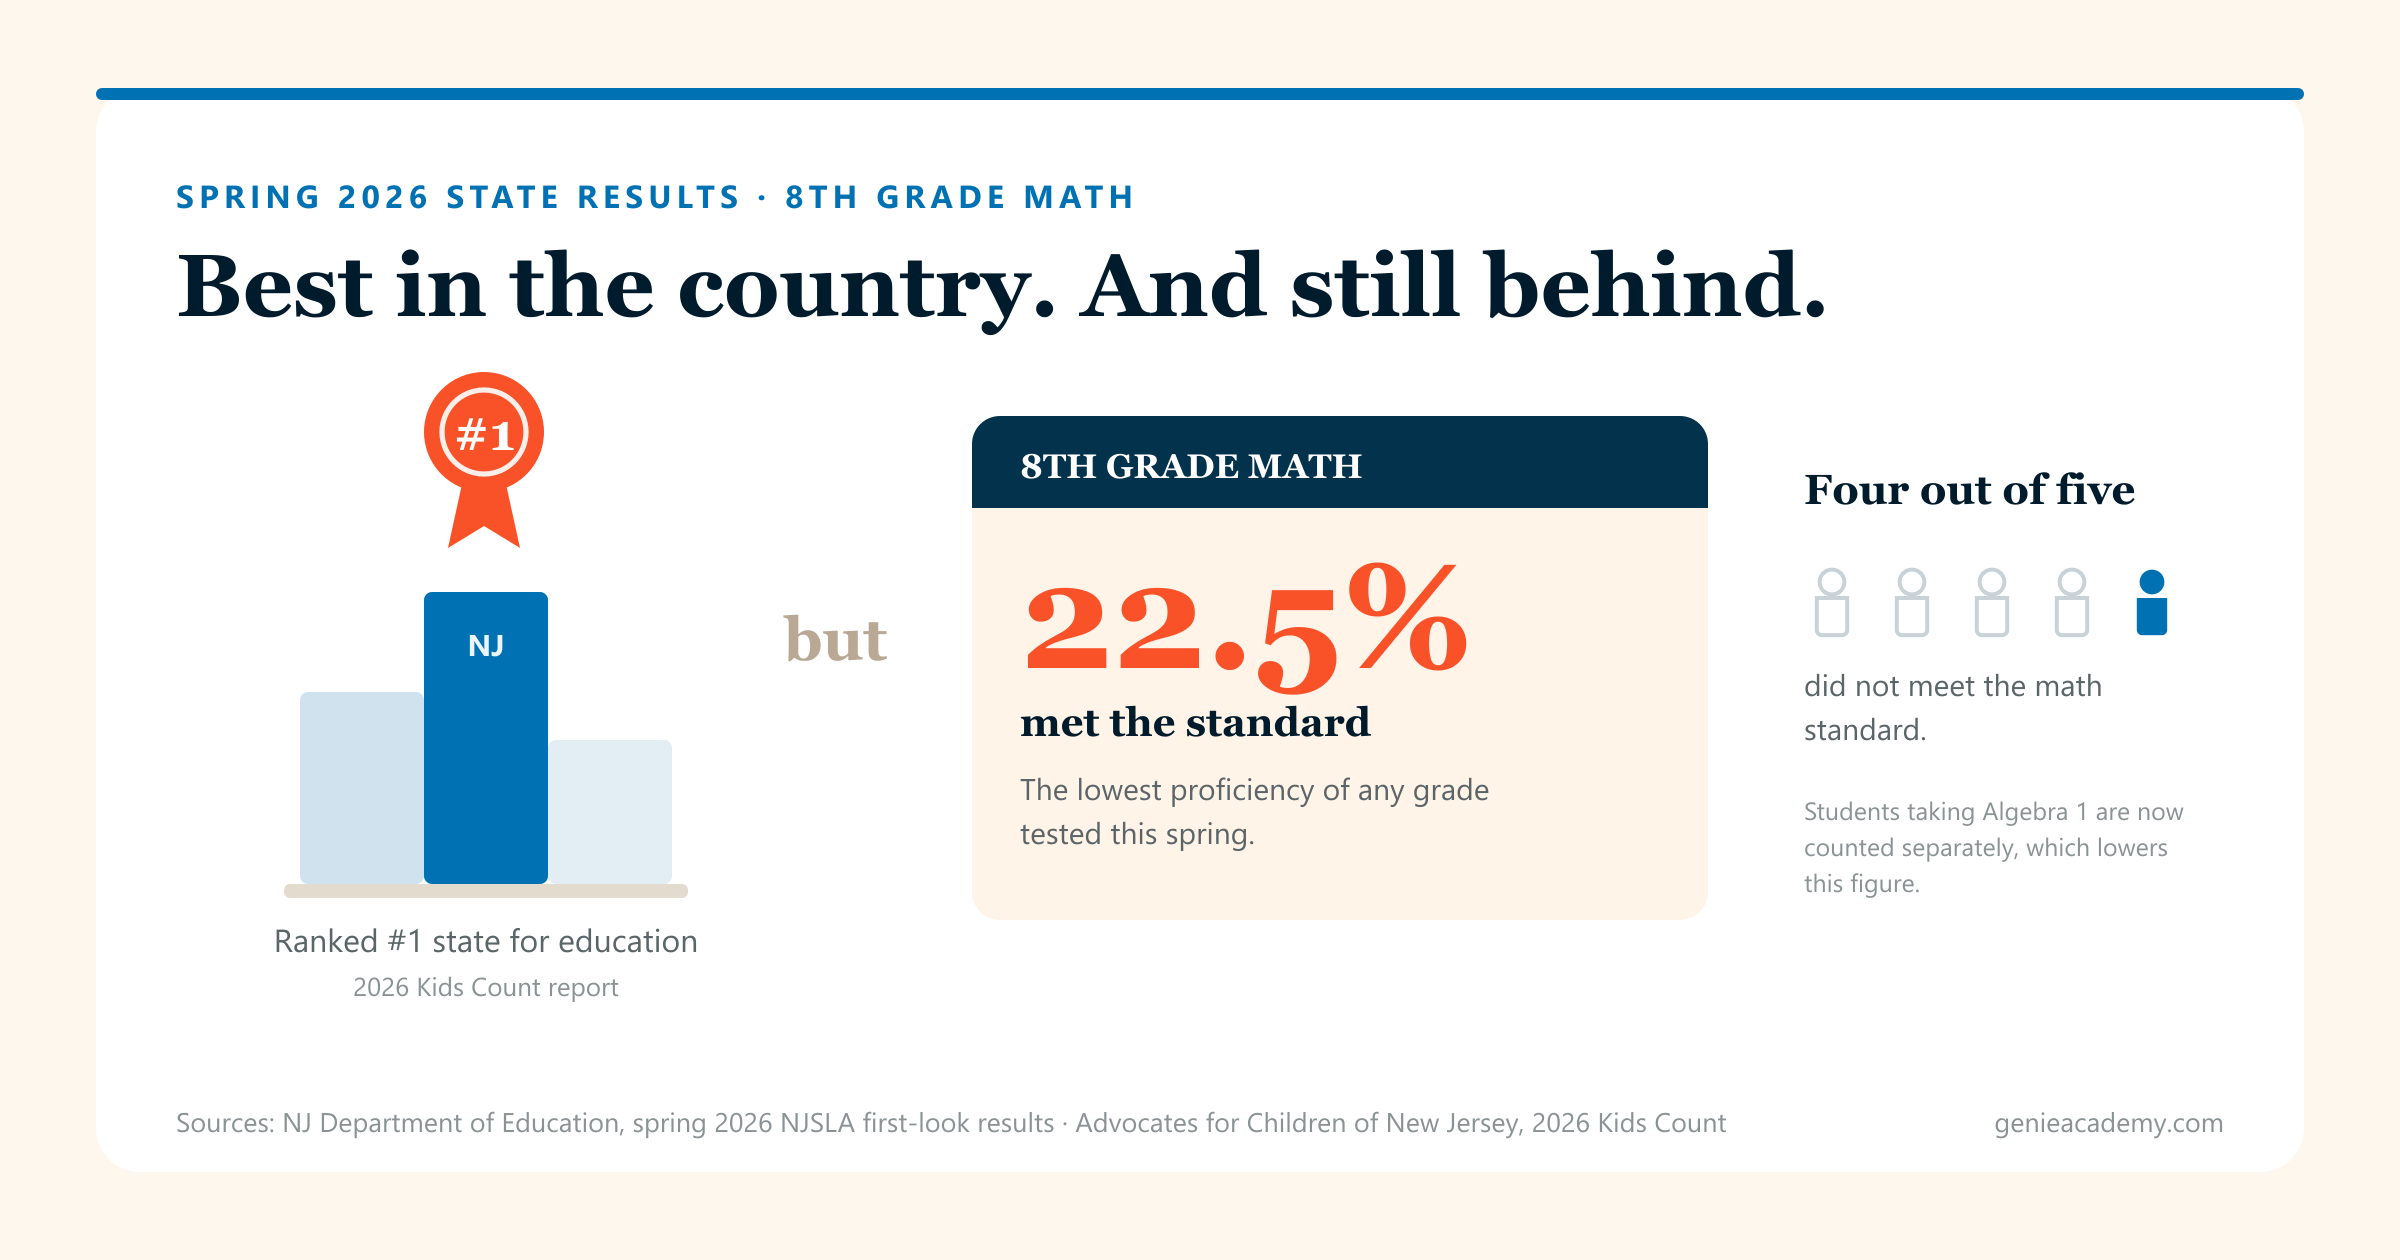


Your child is already curious. Let's channel that.
Genie Academy builds focus, confidence, and a love of learning — math, reading, writing & coding in NJ.
Get Your Child's Free Assessment